
The full guide
Instagram and WhatsApp DM analytics: how to read the numbers and reply better
Five questions answer how your chats are doing: the story, what they sold, how fast people heard back, which automations did the work and where people write from.
Analytics for a DM inbox should answer the questions an owner actually asks on a Monday morning: did our chats bring people in, did they get answers fast, which automations did the work, where and when do people write, and did any of it make money. A wall of charts answers none of them. ChatinFlow's Analytics page is built around those five questions, in plain sentences first and charts second. This guide walks through every tab, explains what each number means and where it comes from, and shows how to turn what you read into changes that make the next week better.
Five questions DM analytics should answer
Open Analytics in the sidebar. The page is titled "What your chats turned into", and five tabs sit under it, each one a question.

| Tab | The question it answers | Typical numbers |
|---|---|---|
| The story | What happened, in plain words? | New conversations, share of replies sent by automations and AI, time to first answer, list growth |
| Results | What did the chats bring in? | New contacts, consent, unsubscribes, sales and the return on what you spent |
| Answers | How fast did people hear back? | Conversations started, average time to the first answer, messages in and out |
| Automations | What did the work for you? | Runs per automation, share finished without an error, broadcast messages, AI spend on your key |
| Channels | Where do people write from, and when? | Messages per channel, delivery and read rates, connection health, busiest hours |
Above the content, three filters apply to every tab: a channel, a period of 7, 30 or 90 days, and the step of the charts, daily, weekly or monthly. Export downloads the numbers behind the view.
How often DM analytics update
Analytics is not a live stream. Today's numbers are rebuilt every hour, and each night the previous three days are checked again so a missed run fixes itself. A message that arrived a few minutes ago can take up to an hour to show up in a chart. For what is happening right now, the inbox and each automation's Activity view are the live places to look.
Every comparison reads against the same length of time just before, so "20% fewer than the 30 days before" compares the last 30 days with the 30 days before them.
The weekly story: what changed in your DMs
The first tab is the short version, written to be read in a minute. It opens with four lines that summarize the period.
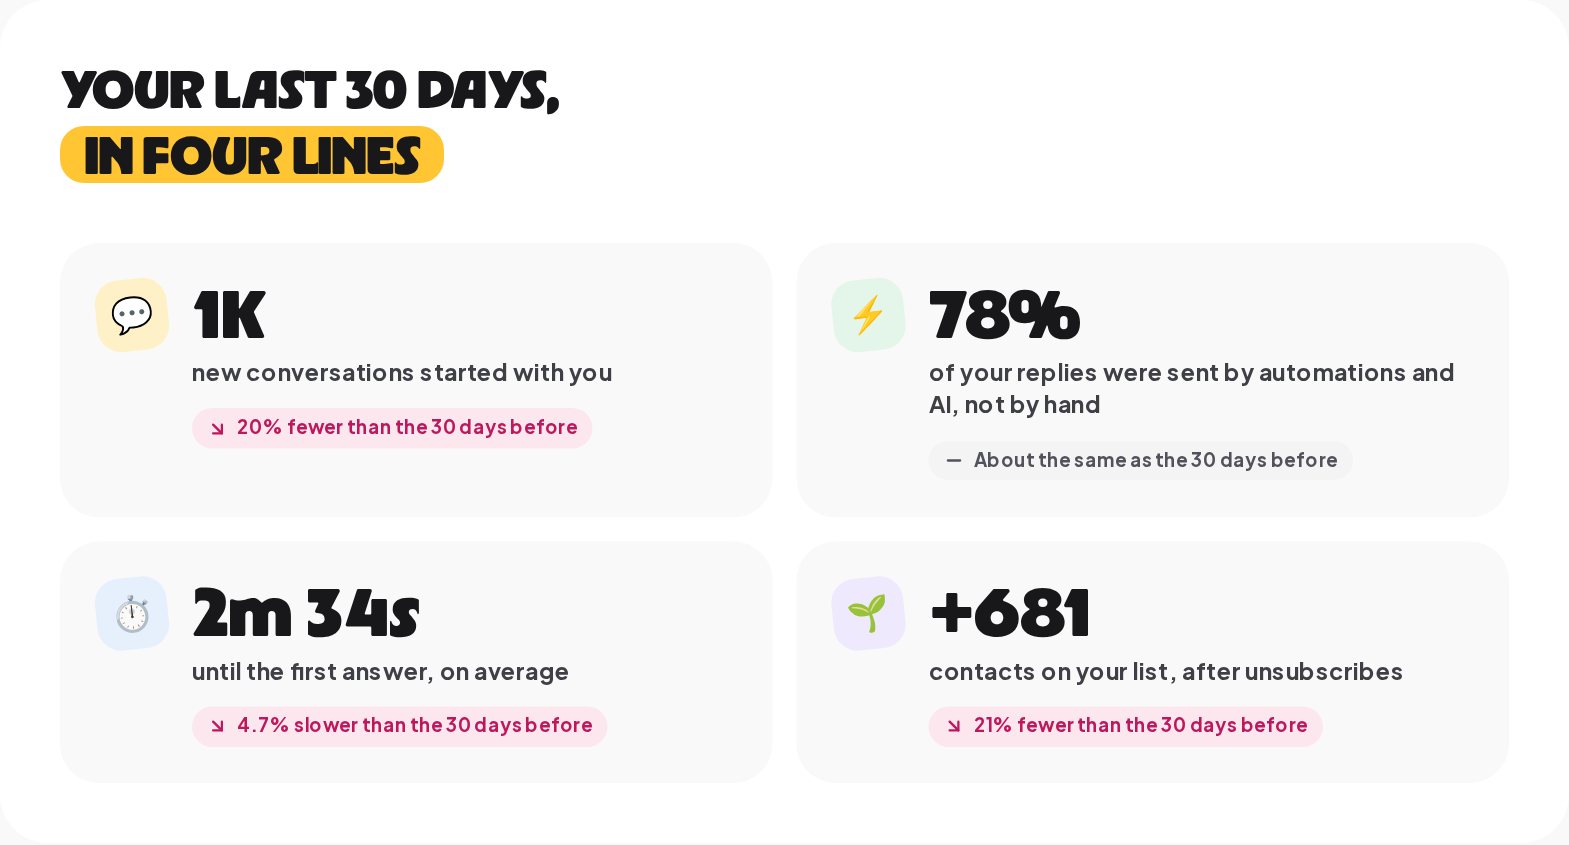
- New conversations started with you. Conversations that began in the period, on every channel the filter includes.
- Replies sent by automations and AI. The share of all your replies that no person typed. A high share is good when the answers are right; it is the measure of how much work automation takes off your team.
- Time until the first answer. The average wait between a new conversation and its first reply, from automation, AI or a person.
- Contacts on your list, after unsubscribes. How much your list grew, net.
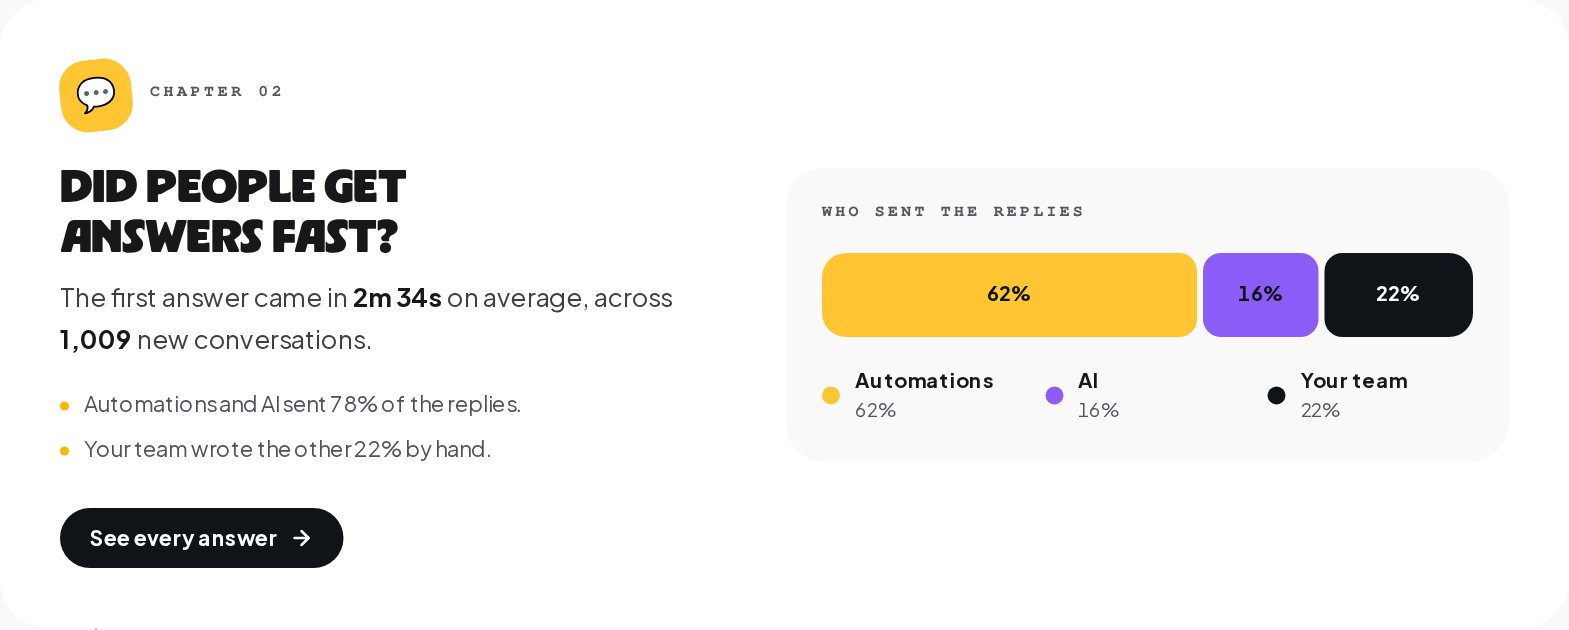
Below the four lines, chapters answer one question each: did your chats bring people in, did people get answers fast, which automations did the work, where and when people write, and whether everything ran smoothly. Each chapter has a sentence, two or three supporting facts, a chart and a button to the place where you can act on it.
A useful habit: read The story every Monday and write down the one line that surprised you. A surprise is where the next improvement is.
DM results: leads, bookings and sales from chats
Results answers what your chats brought in. It opens with four numbers: new contacts, contacts on your list after unsubscribes, people who said yes to hearing from you again, and unsubscribes in the period.
The chapters go deeper:
- How did your list grow? New contacts day by day, with the best day named, and unsubscribes on the same chart.
- Where did they come from? New contacts by the channel they came in on, as counts and shares.
- Did your marketing pay off? Sales from paid buy buttons, paid orders of a connected store, won deals, the Record a conversion step and the conversions API, set against what you spent. This is where attribution lives; the attribution guide covers it step by step.
"Said yes to hearing from you again" counts the contacts who gave their consent to future messages in the period. It is the number to watch before you plan broadcasts, because it is the audience you can message later.
Response time and answer rate
Answers is about speed and volume. Its summary shows new conversations, the average time to the first answer, messages that came in from customers and replies that went out.
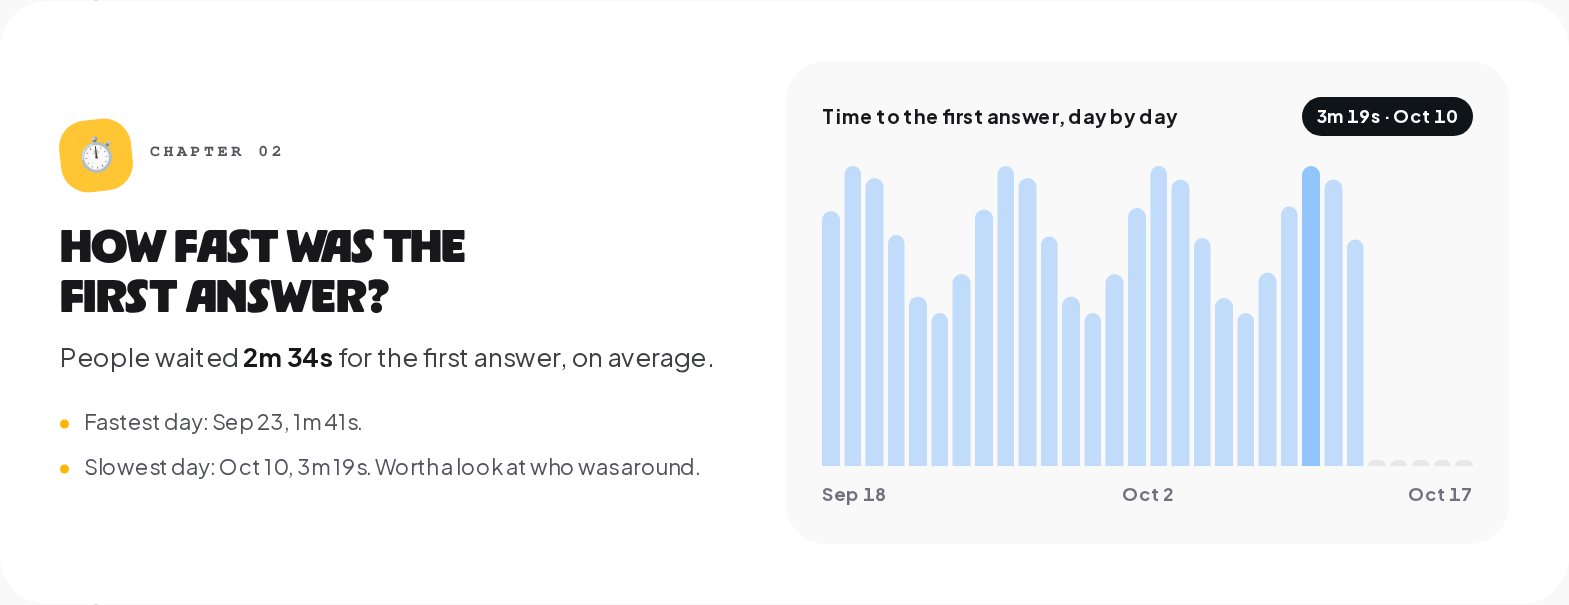
The chapters show when conversations started, with the busiest day, how fast the first answer was day by day, with the fastest and slowest days named, and how many messages went back and forth, split between automations and AI and your team.
How to use it:
- A slow day is a staffing question. If the slowest day is always a Saturday, either put someone on the inbox or add an away message automation for the weekend.
- A rising first answer time with a steady volume usually means an automation stopped answering, for example a keyword changed in a caption but not in the trigger. Check the Automations tab next.
- A high share of team replies on simple questions is a list of automations to build. Open the inbox, find the questions your team keeps answering by hand, and turn the top three into keyword automations.
Automation analytics: which flows do the work
Automations shows what did the work for you. Its summary: total automation runs, the share that finished without an error, broadcast messages that went out, and what you spent on AI on your own key.
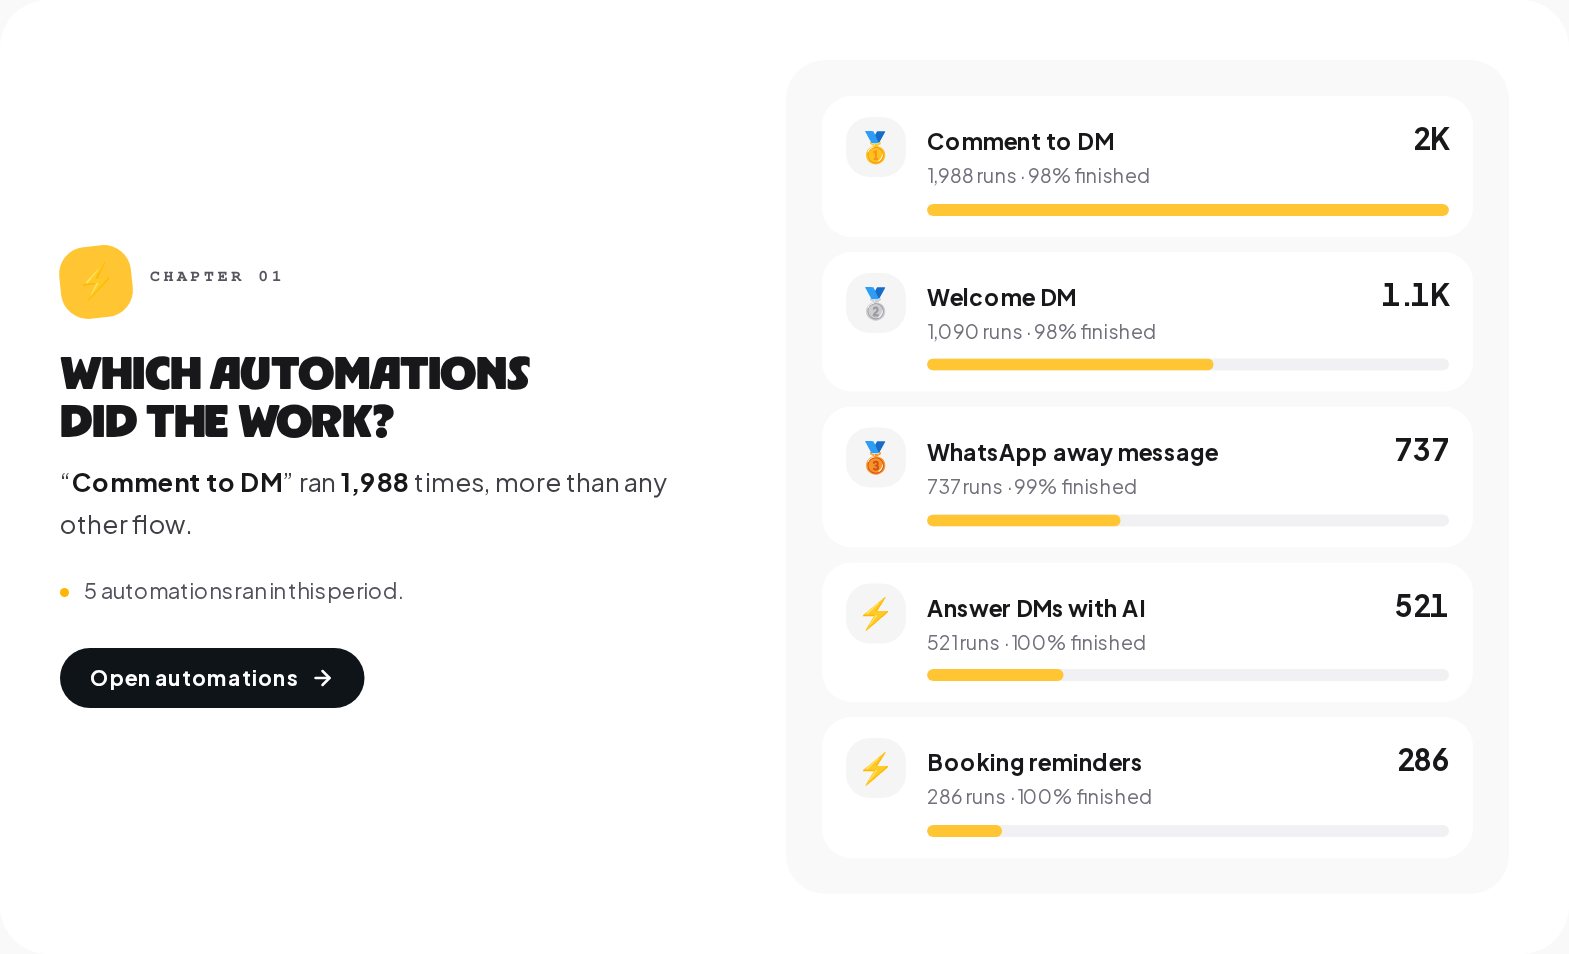
The chapters list which automations ran most, with runs and the share finished, whether the runs finished, with the ones that stopped on an error counted day by day, and whether your messages arrived, as delivered and read per hundred sent, with the number that could not be sent.
Three readings that lead somewhere:
- An automation with many runs and a low finish rate has a failing step. Open its Activity tab: every run is listed with how it ended, how long it took and where it stopped, and the step that fails most often is named.
- A top automation that should not be on top, such as a fallback reply that runs more than your keyword automations, means people are not using your keywords. Put the keyword in the post, in capitals, and check it with the Keyword Tester.
- Messages that could not be sent often hit a messaging window. On Instagram and Messenger, free-form messages go out only within 24 hours of the person's last message, and a broadcast's Deliveries tab shows the reason for each one.
Channel analytics: Instagram, WhatsApp, Messenger and Telegram side by side
Channels answers where people write from, and when. The summary shows messages across your channels, the share of the busiest channel, your busiest hour and connection health across your channels.
The first chapter shows each channel side by side: messages in the period, what came in and went out, the first answer time, the delivered, read and failed rates, and how many of its connections are working. The second chapter is the one most owners print out.
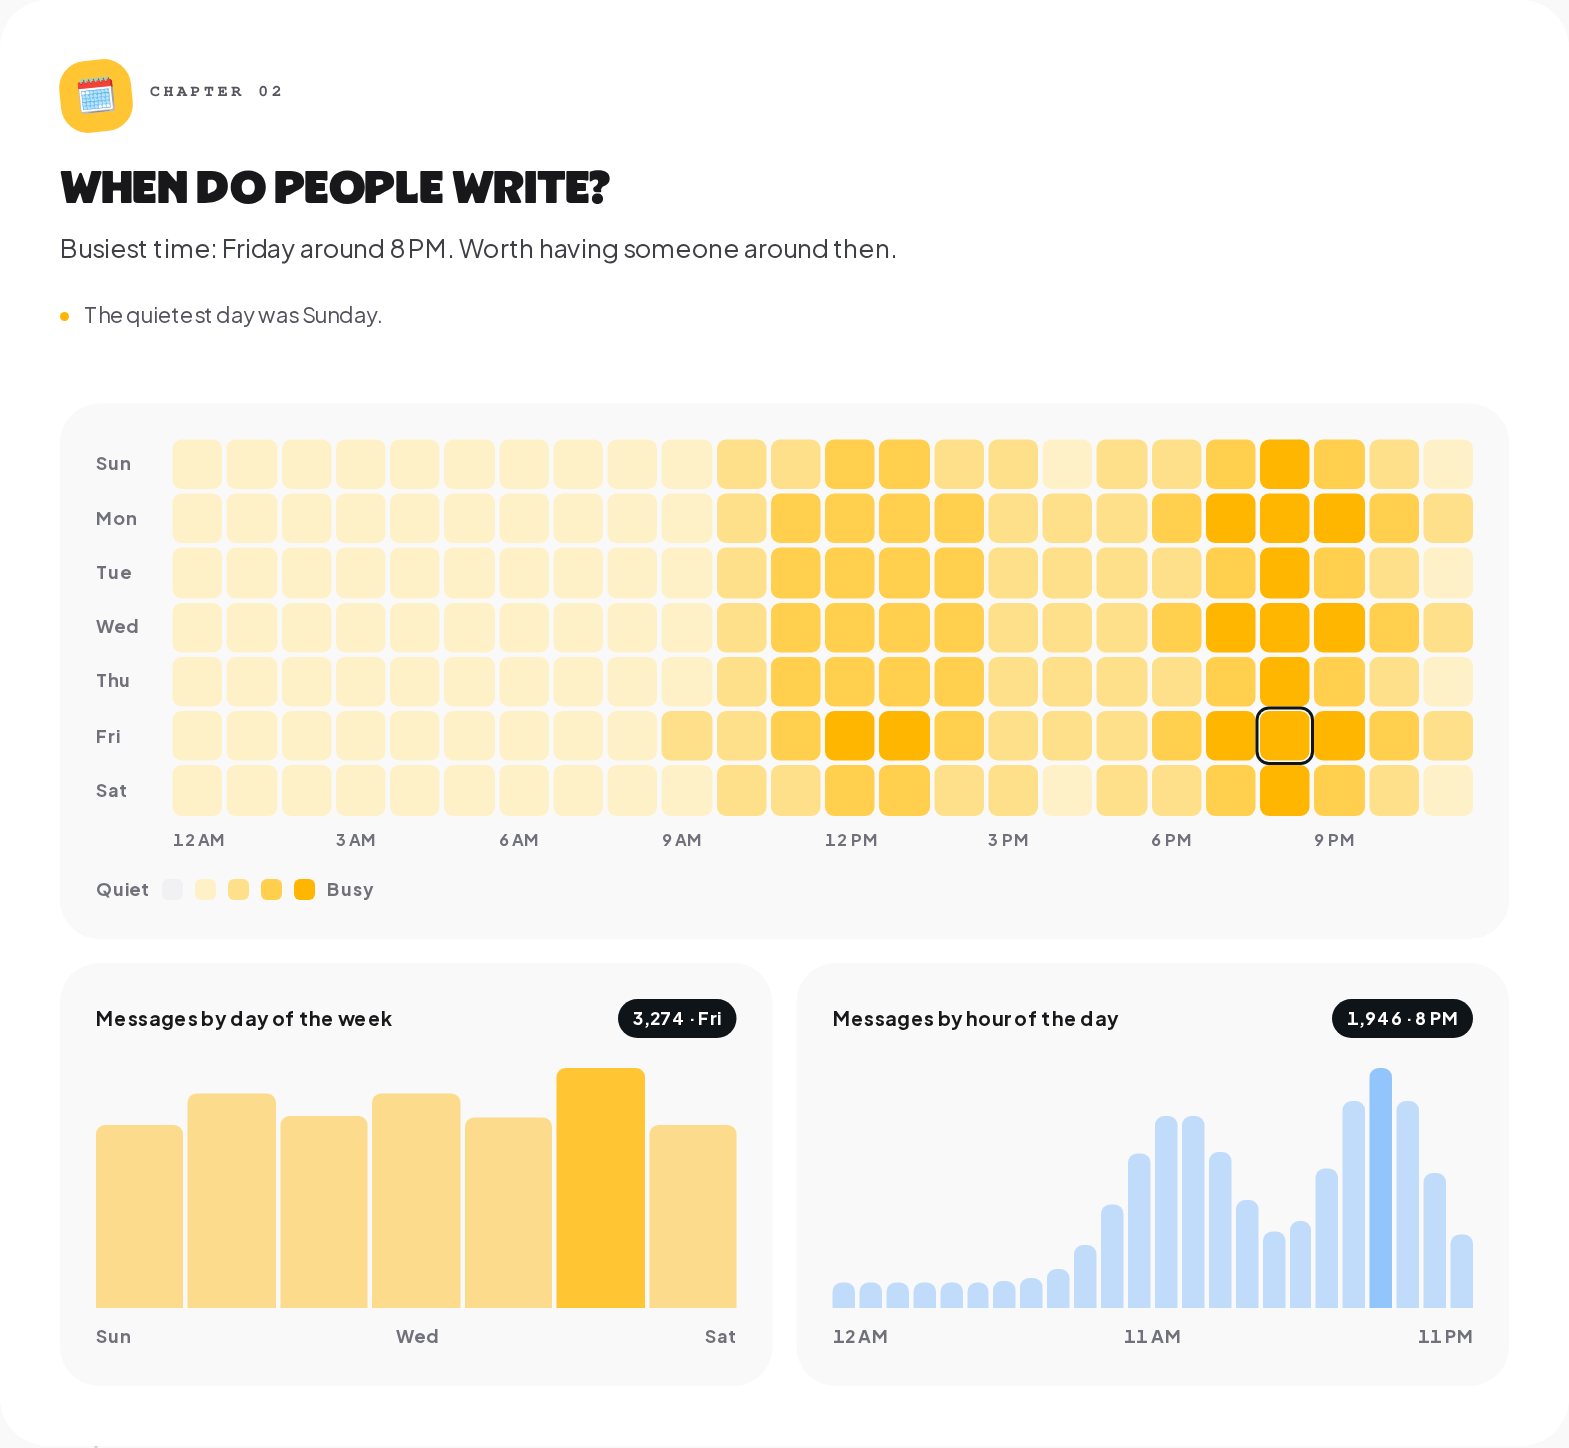
The heatmap shows messages by day of the week and hour of the day, with the busiest time named in a sentence, such as "Friday around 8 PM. Worth having someone around then." Below it, two charts total the messages by day and by hour.
Use it to plan three things: when someone should be on the inbox, when an automation should run on a schedule instead of always, and when to send a broadcast. A broadcast at the hour your customers already write is a broadcast they see.
The data behind the totals
Analytics is the overview. Two other places hold the detail.
Each automation's Activity tab shows totals, success rate, average duration and failures for the last 24 hours, 7, 30 or 90 days, a chart of runs over time, and every run with how it ended and where it stopped. Start here when one automation looks wrong.
Each broadcast's detail shows the audience, how many were sent and how many failed, and on the Deliveries tab every recipient with a status, pending, sent, failed or skipped, and the reason the provider gave.
For your team, Settings, Inbox shows who is handling what right now: open, pending and resolved conversations per teammate, plus the unassigned ones.
A 15-minute weekly DM analytics review
Numbers help only when they change what you do. A routine that fits in a coffee break:
- The story, 7 days. Read the four lines and the chapter sentences. Note anything that moved more than 20%.
- Answers. Find the slowest day. Decide whether it needs a person, an away message or a schedule.
- Automations. Open the automation with the lowest finish rate and read its failing step. Fix one thing.
- Channels. Check connection health and how many connections are working. A connection that is not working sends nothing until you reconnect it.
- Results. Compare new contacts with last week, and look at what sold.
- Inbox. Find two questions your team answered by hand more than three times, and build the automation for one of them.
Export DM analytics to CSV, the API or your BI tool
Analytics does not sync with GA4, Mixpanel, Amplitude, Segment or a data warehouse. To use the numbers elsewhere:
- Export as CSV. The daily numbers of the current view, on the plans that include it. Build your own report in Sheets, Excel or a BI tool.
- The ChatinFlow API. Analytics, contacts and conversations through the REST API with a personal access token, on the plans with API access.
- Events from a flow. An HTTP request step sends an event to another tool the moment something happens in a conversation, and the Post to Slack step tells a Slack channel you connected.
There is no report builder, no scheduled report, no cohort analysis and no lifetime value calculation; start from the contacts export or the API if you need them.
DM analytics mistakes to avoid
- Reading one day. A single slow or busy day is noise. Read 7 or 30 days, and compare with the period before.
- Chasing the total message count. More messages is not better by itself. Answers that came fast and led somewhere are.
- Ignoring the finish rate. An automation that runs a thousand times and fails on step three fails a thousand people.
- Blaming the channel for an empty chart. Check connection health first; a disconnected account sends nothing.
- Expecting live numbers. Charts can lag by up to an hour. Use the inbox and Activity for now.
DM analytics: FAQ
What is each number compared with?
With the same length of time just before. A 30-day view compares the last 30 days with the 30 days before them, and says so in words under each number.
Why does a chart show nothing for today?
Today's numbers are rebuilt every hour, so the newest hour can still be missing. Check back later, or open the inbox to see live messages.
Can I see analytics for one channel only?
Yes. The channel filter above the tabs applies to every tab, together with the period and the chart step.
Where do I see why an automation failed?
In that automation's Activity tab. Every run shows how it ended and the step where it stopped, and the step that fails most often is named.
Sources
- Messenger Platform and IG Messaging API policy, Meta for Developers, on the 24-hour window behind messages that could not be sent.
- Webhooks for Messenger Platform, Meta for Developers, on delivery and read receipts.