The full guide
How to calculate Instagram engagement rate, by followers and by reach
Engagement rate is the most quoted number in social media and one of the most misunderstood. Two people can look at the same post and report rates that differ by a factor of two, both correctly, because they divided by different things.
Engagement rate is the most quoted number in social media and one of the most misunderstood. Two people can look at the same post and report rates that differ by a factor of two, both correctly, because they divided by different things. Brands compare creators with it, creators judge their own posts with it and almost nobody says which formula they used. This guide explains the two formulas that matter, when to use each, which interactions to count, what a good rate looks like for an account your size and how to work it out for any post in a minute.
The two formulas
| Formula | How it is worked out | What it tells you |
|---|---|---|
| By followers | Interactions divided by followers, times 100 | How strongly your audience as a whole responds |
| By reach | Interactions divided by accounts reached, times 100 | How the post landed with the people who actually saw it |
Interactions are the actions people take on a post: likes, comments, saves and shares. Views are not interactions; watching is not the same as responding.
The two rates answer different questions, which is why they differ so much. Followers include people who never saw the post, so the rate by followers is lower. Reach counts only people who saw it, including people who do not follow you, so the rate by reach is higher and says more about the post itself.
When to use each
Use the rate by followers to compare accounts with each other, or to follow your own account over time. Follower counts are public and stable, so anyone can work out the rate the same way. It is also the number brands usually ask for.
Use the rate by reach to judge one post. A reel that reached a large number of non-followers will look weak by followers even if the people who saw it loved it. By reach, it shows how good it really was.
When in doubt, work out both. The calculator always shows both when you give it reach.
Which interactions to count
Different tools count different things, which is another reason rates do not match.
- Likes and comments are public, so they are the base of most published benchmarks.
- Saves and shares are only visible to you in Insights. They are also the strongest signals: a save means "I want this again", a share means "someone else should see this". Instagram has said that sends, meaning shares in DMs, weigh heavily in how it recommends content.
The calculator counts all four in your rates when you add them, and leaves saves and shares out of the comparison with the reference line. The reference line is built from likes and comments only, so the comparison stays like for like.
A worked example
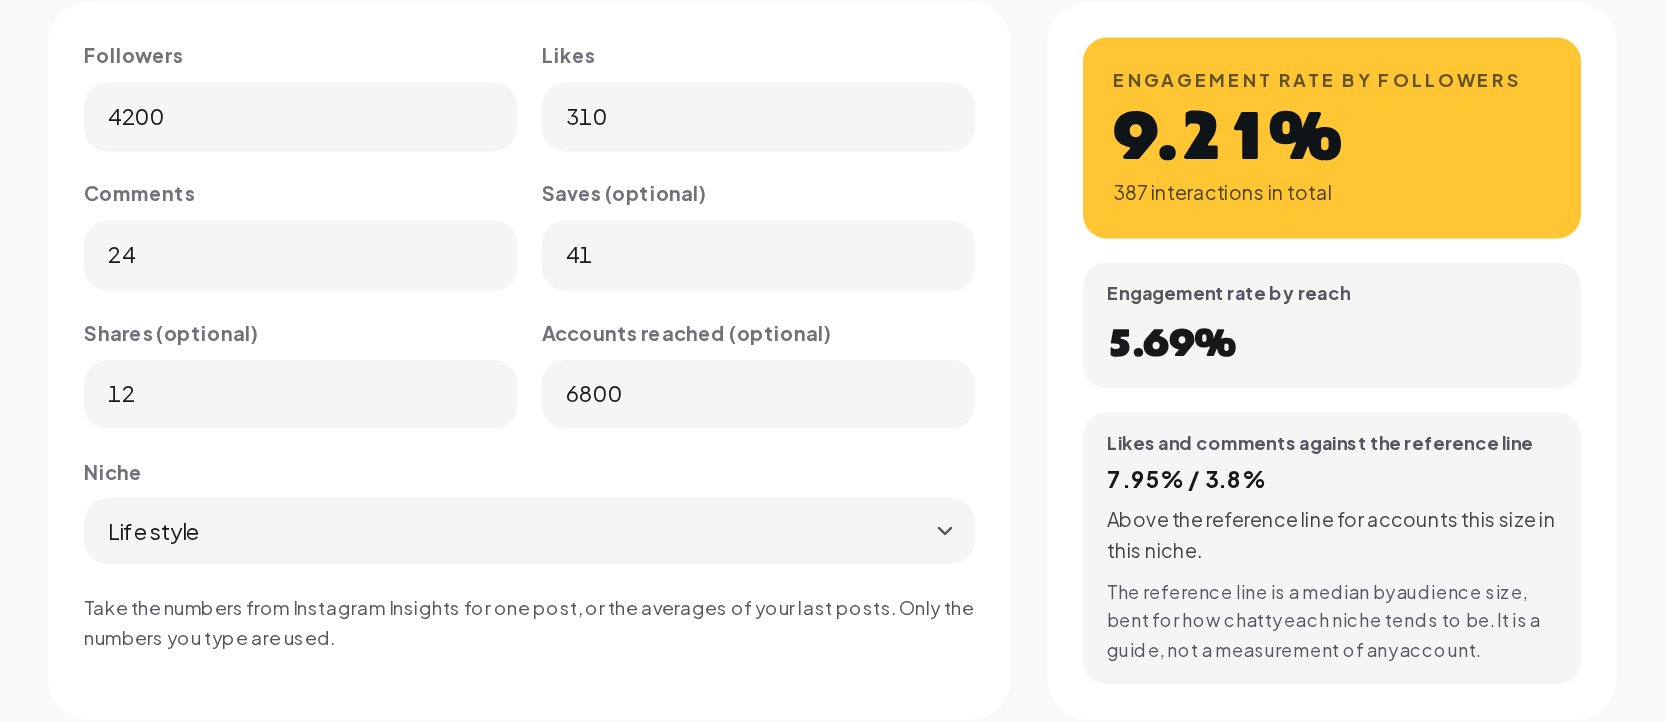
Take one post with these numbers from Insights:
| Number | Value |
|---|---|
| Followers | 4,200 |
| Likes | 310 |
| Comments | 24 |
| Saves | 41 |
| Shares | 12 |
| Accounts reached | 6,800 |
- Interactions: 310 + 24 + 41 + 12 = 387.
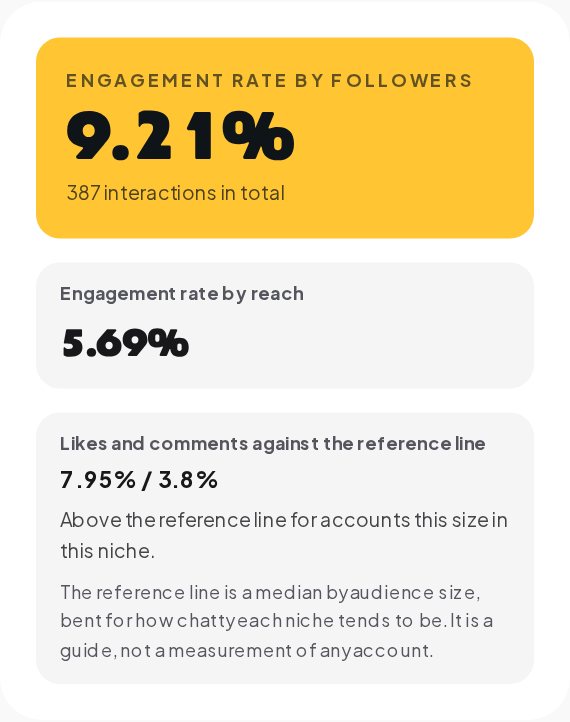
- Rate by followers: 387 divided by 4,200, times 100 = 9.21%.
- Rate by reach: 387 divided by 6,800, times 100 = 5.69%.
- Likes and comments only, against followers: 334 divided by 4,200, times 100 = 7.95%, the figure compared with the reference line.
Notice that the rate by reach is lower here. That happens when a post reaches more people than you have followers, a sign that it travelled beyond your audience. The formula did not fail; the post did well with strangers, who engage less than followers do.
What is a good engagement rate?
There is no single answer, and anyone who gives you one number for every account is guessing. Two things move the typical rate a lot: the size of the account and the kind of audience.
By audience size
Smaller accounts have closer audiences and higher rates. The reference line starts from widely published medians for engagement by followers, counting likes and comments:
| Followers | Reference line |
|---|---|
| Under 10K | 3.8% |
| 10K to 100K | 2.3% |
| 100K to 1M | 1.5% |
| 1M and more | 1.0% |
By niche
The line is then bent for how chatty each kind of audience tends to be:
| Audience type | Niches | Adjustment |
|---|---|---|
| Morning routines | Fitness, wellness | A little higher |
| Evening audiences | Gaming, music, pets, sports, automotive | A little higher |
| Creators | Fashion, beauty, travel, art, photography | Slightly higher |
| Everyday consumers | Food, home, parenting, events, lifestyle | No change |
| Professional | Business, finance, tech, real estate, education | Lower |
For an account between 10K and 100K, the line sits at about 1.8% for finance and about 2.6% for fitness. The same 1.8% is right on the line for the finance account and below it for the fitness one. The comparison only means something within a niche and a size.
How the verdict is given
The calculator compares your likes and comments rate with the line for your size and niche and gives one of three verdicts:
- Above the line: 15% or more over it.
- Close to the line: within 15% either side.
- Below the line: more than 15% under it.
The band of 15% is there because one post swings a lot. Do not read a small gap as a trend.
Getting the numbers from Instagram
- In the Instagram app, open the post and tap View insights.
- You will find likes, comments, saves and shares in the interactions section, and accounts reached near the top.
- Your follower count is on your profile.
For a fuller picture of the account, take the averages of your last eight to ten posts instead of one post. A single post can be lifted by a lucky share or flattened by a bad hour; an average shows what your audience usually does.
Why your rate drops as you grow
Many accounts see their rate fall as their following grows and worry that something is wrong. Usually nothing is. Early followers are often friends, customers and people who found you through a specific post they loved. Later followers include people who followed casually and rarely engage. More followers also means the denominator grows faster than the core of people who respond.
That is why comparing a rate with a line for your size matters. The reference line itself drops from 3.8% to 2.3% as an account crosses 10K, so a falling rate on its own is normal. A rate below the line for your size is the thing to look at.
How to raise engagement
- Ask for one specific thing. A post that ends with "comment the word GUIDE and I'll send it" gets more comments than one that ends with "thoughts?".
- Make posts worth saving. Checklists, recipes, step by step guides and carousels with real information get saved. Saves count.
- Reply to comments, fast. Every reply is another comment on the post and a reason for the person to come back. Conversations in the comments also signal to Instagram that the post is worth showing.
- Post when your audience is around. A post that gets its first reactions quickly has a better start. The Best Time to Post tool shows the busy hours for your niche.
- Fix the first line. The Post Advisor checks the hook, the call to action and the hashtags of a caption against the same reference line.
Common mistakes
- Comparing rates worked out in different ways. A rate by reach and a rate by followers are different numbers. Ask which one before comparing.
- Judging the account by one post. Use an average of recent posts.
- Counting views as engagement. Views measure reach, not response.
- Buying followers. Fake followers never engage, so they push the rate down. It is one of the clearest signs brands look for.
Working out your rate in a minute
- Open the Engagement Rate Calculator.
- Type your followers, then the likes and comments of the post. These three are enough.
- Add saves, shares and accounts reached if you have them for a fuller result and the rate by reach.
- Pick your niche so the reference line fits your audience.
- Read both rates and the verdict against the line.
Only the numbers you type are used. There is no hidden average from other accounts behind the result.
From engagement to conversations
Comments are the engagement that sells. A comment asking about the price or the link is a customer raising a hand, and how fast you answer often decides whether they buy. With Instagram automation in ChatinFlow, every comment can get a reply and a DM with the details in seconds, so the conversation keeps going while the person is still interested.
Quick answers
What is the formula for engagement rate on Instagram?
Add likes, comments, saves and shares, divide by followers and multiply by 100. Divide by accounts reached instead for the rate by reach.
What is a good engagement rate?
It depends on size and niche. Published medians by followers run from about 3.8% for accounts under 10K down to about 1% for accounts over a million.
Is engagement by reach better than by followers?
Neither is better. By reach judges one post, by followers compares accounts and tracks yours over time.
Sources
- Instagram Platform: Insights, Meta for Developers.